SeeSAR
Drug Design Dashboard







| What would you like to do? | Link |
| Where can I download the Chemical Spaces? | Download |
| Where can I download the BioSolveIT software? | Download |
| Where can I get an evaluation license for a two-week free trial? | Request License |





| Chemical Space Docking® | V-SYNTHES2 |
| Real synthon with a neutral extension marker | Minimal Enumeration Library product |
| Optional ligand-template support | Geometry-based CapSelect |
| Pharmacophore constraints during anchoring and extension | Automated pose-productivity selection |
| Interactive review in SeeSAR | Automated cluster-oriented workflow |
| Campaign | Nominal collection | Explicit docking evaluations | Core-hours used | Nominal compounds represented per core-hour | Relative to C-S-D | Training or pre-screening context |
| C-S-D Benchmark | ||||||
| C-S-D PKA / REAL Space | 76 × 109 | 10.67 × 10⁶ | 14,204 | 5.4 × 10⁶ | 1.00× | No machine learning. Includes anchoring, two extension stages, coordinate generation, docking, scoring, and annotation using 288 CPU cores. |
| Full-Library and Multistage Docking Campaigns | ||||||
| Gorgulla et al. VirtualFlow / KEAP1 | 1.3 × 10⁹ | ~1.3 × 10⁹ | ~3–4.5 × 10⁶ | ~300–420 | ~13,000× slower | The complete collection was explicitly docked. The core-hour estimate covers first-stage docking; higher-accuracy rescoring costs are excluded. |
| Liu et al. AmpC | 1.7 × 10⁹ | 1.7 × 10⁹ | 2 × 10⁶ | ~800 | ~7,000× slower | Full-library DOCK3.8 calculation. The reported core-hours cover docking but not necessarily every downstream campaign operation. |
| Shape- and Machine-Learning-Guided Campaigns | ||||||
| Zhou et al. OpenVS / KLHDC2 | 5.5 × 10⁹ | ~6 × 10⁶ | ≤500,000 | ~11,000 | ~500× slower | Initial docking calculations supplied training and testing data, followed by iterative docking, neural-network retraining, and full-space inference. |
| Zhou et al. OpenVS / NaV1.7 | 4.1 × 10⁹ | ~4.5 × 10⁶ | ≤500,00 | ~8,100 | ~650× slower | The active-learning workflow stopped after seven iterations. The maximum allocation includes docking, training, prediction, and iterative selection. |
| Luttens et al. ML-guided screen, per target | 3.5 × 10⁹ | 6 × 10⁶ | ~18,000 | ~270,000 | ~25× slower | The first compute block includes docking the training set, model training, and prediction across the nominal collection; final docking adds another 10,344 core-hours. |
| Synthon- and Chemical-Distance-Based Accelerated Workflows | ||||||
| Sadybekov et al. Original V-SYNTHES | 11 × 109 | ~2 × 10⁶ | Not reported | Not calculable | Not calculable | No machine learning. A Minimal Enumeration Library was docked first, followed by iterative enumeration and docking of selected products. |
| Nazarova et al. V-SYNTHES2 | 36 × 109 | 3.8 × 10⁶ | 38,400 | ~940,000 | ~6× slower | No machine learning. CapSelect selects productive MEL poses before hierarchical enumeration and docking of a reduced set of complete products. |
| Mailhot et al. ChemSTEP / AmpC | 13 × 109 | ~4.4 × 10 | ~45,000 | ~290,000 | ~20× slower | No machine-learning training. The estimate combines iterative chemical-similarity traversal with molecular building and docking of approximately 0.033% of the nominal collection. |
|
Calculation basis: Nominal compounds represented per core-hour = nominal collection size ÷ reported or derived total core-hours. For example, C-S-D represents 76 billion nominal products using an upper-bound allocation of 14,204 core-hours, corresponding to approximately 5.35 million nominal products per core-hour. For V-SYNTHES2, 36 billion nominal products divided by 38,400 CPU-hours gives approximately 937,500 nominal products per core-hour. For ChemSTEP, 13.2 billion nominal products divided by the combined estimate of approximately 45,467 core-hours gives approximately 290,000 nominal products per core-hour. Important: This metric describes how much nominal library or Chemical Space is represented by the computational workflow per core-hour. It is not a literal rate of complete molecules individually generated, docked, or scored. Accelerated synthon-, similarity-, shape-, and machine-learning-based methods explicitly process only selected representative subsets, while brute-force campaigns dock most or all compounds individually. The campaigns use different docking engines, scoring functions, sampling depths, protein targets, molecular representations, filtering rules, hardware generations, and definitions of total compute. The values therefore provide computational context rather than a controlled head-to-head benchmark. Full methodological details are available in the linked publications. |
||||||
| Campaign | Search objective | Nominal collection | Explicitly evaluated | CPU usage | Nominal compounds represented per core-hour | Relative to C-S-D | Interpretation |
| C-S-D Reference Benchmark | |||||||
| C-S-D PKA / REAL Space | Structure-based Chemical Space Docking | 76 × 109 | 10.7 × 10⁶ | 14,204 core-hours | 5.4 × 10⁶ | 1.00× | Complete workflow allocation including anchoring, extension, coordinate generation, docking, scoring, and annotation. |
| Original Thompson-Sampling Benchmarks | |||||||
| Klarich et al. Thompson sampling | ROCS 3D shape similarity | 234 × 106 | ~2.3 × 10⁶ | 32 core-hours | 7.3 × 10⁶ | 1.37× faster | Slightly higher nominal-space coverage, but ROCS shape similarity and structure-based docking answer different questions. |
| Klarich et al. Thompson sampling / JNK3 | Protein–ligand docking | 335 × 106 | ~3.3 × 10⁶ | 16,000 | 21,000 | 250× slower | The closest original structure-based comparison. Thompson sampling recovered more than half of the exhaustive top 100 after evaluating 1% of the library. |
| Enhanced Sampling and Parallelization Benchmarks | |||||||
| Zhao et al. TS/RWS parallel benchmark | ROCS 3D shape similarity | 100 × 106 | 200,00 | 64 | ~1.6 × 10⁶ | 3× slower | Near-linear CPU scaling was achieved, although this remains a shape-similarity rather than docking comparison. |
| Zhao et al. TS/RWS parallel benchmark | FRED protein–ligand docking | 100 × 106 | 200,00 | ~80–115 | ~0.9–1.18 × 10⁶ | ~5× slower | The closest newer docking comparison. The range reflects reduced parallel efficiency when moving from one to 64 CPU cores. |
|
Calculation basis: Nominal compounds represented per core-hour = nominal collection size ÷ reported or derivable CPU core-hours. For C-S-D, 76 billion nominal products divided by an upper-bound allocation of 14,204 core-hours gives approximately 5.35 million nominal products per core-hour. Important: This metric measures the nominal size of the collection addressed by a workflow relative to its CPU allocation. It does not mean that every nominal product was individually generated, docked, or scored. Thompson sampling, RWS, SALSA, and C-S-D explicitly evaluate selected representatives and infer or construct coverage of the remaining combinatorial space.The rows are not controlled head-to-head benchmarks. ROCS shape comparison, FRED docking, and C-S-D use different molecular representations, scoring costs, targets, sampling depths, and definitions of an evaluation. Comparisons are most meaningful between the structure-based docking rows. |
|||||||
| Rank | Method | Search type | Mean runtime per query | Relative to ECFP4 | Assessment |
| Performance Across Six Combinatorial Chemical Spaces | |||||
| 1 | ECFP4 | Fingerprint similarity | 0.031 s | Fastest | Best overall runtime performance. Results are returned within approximately 31 milliseconds per query on average. |
| 2 | fCSFP4 | Feature-enriched fingerprint similarity | 0.045 s | 1.4× slower | Only moderately slower than ECFP4 while incorporating additional feature information. |
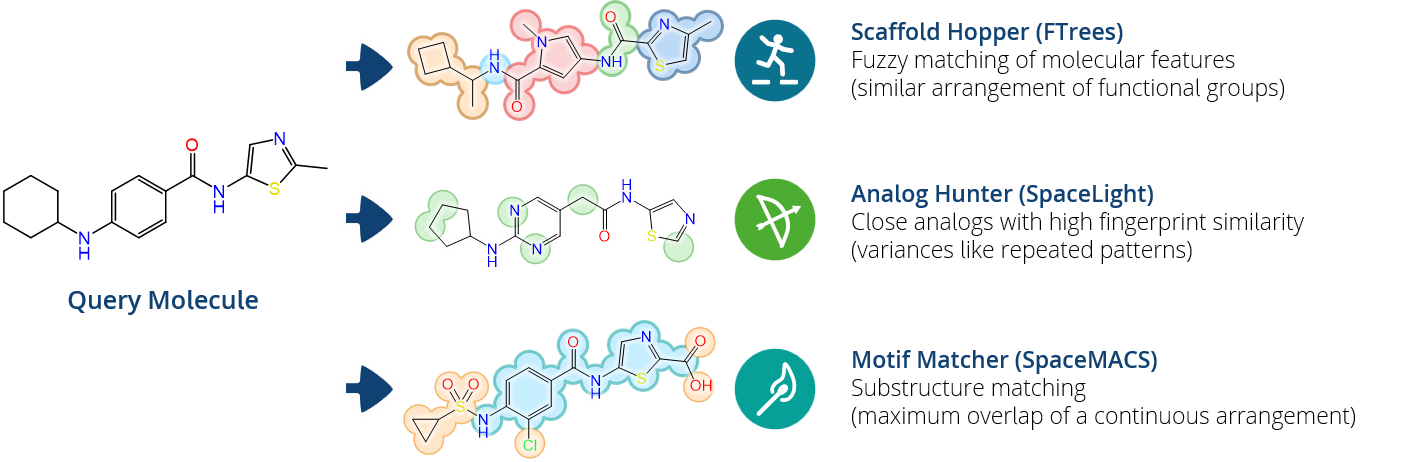
| 3 | SpaceMACS | Maximum common substructure similarity | 0.053 s | 1.7× slower | Provides more structurally explicit similarity searching while retaining millisecond-scale runtimes. |
| 4 | FTrees | Fuzzy pharmacophore similarity | 0.160 s | 5.1× slower | The slowest of the four methods, but offers a more abstract scaffold-hopping search that cannot be replaced directly by fingerprint similarity. |
| Benchmark scope: Mean runtimes were calculated across REAL, GalaXi, Freedom Space, eXplore, CHEMriya, and AMBrosia using 2,917 query molecules per Chemical Space. ECFP4 was the fastest or joint-fastest method in every collection included in the complete benchmark. | |||||
| Method | Search type | Collection-size range | Total runtime range | Size-normalized runtime | Relative performance |
| Enumerated Libraries: Molport, Mcule, Life Chemicals, and ChemDiv | |||||
| ECFP4 | Fingerprint similarity | 0.15–5.9 × 10⁶ | 9–330 s | 54.7 s per 106 compounds | Fastest. Provides the lowest collection-size-adjusted runtime. |
| fCSFP4 | Feature-enriched fingerprint similarity | 0.15–5.9 × 10⁶ | 9–344 s | 56.0 s per 106 compounds | Approximately 1.02× slower than ECFP4 and effectively comparable in runtime. |
| FTrees | Fuzzy pharmacophore similarity | 0.15–5.9 × 10⁶ | 271–14,397 s | 1,843 s per 106 compounds | Approximately 34× slower than ECFP4 after adjusting for library size. |
| SpaceMACS | Maximum common substructure similarity | 0.15–5.9 × 10⁶ | 1,205–41,501 s | 6,793 s per 106 compounds | Approximately 124× slower than ECFP4 on explicitly enumerated libraries. |
| Combinatorial Chemical Spaces: REAL, GalaXi, Freedom Space, eXplore, CHEMriya, and AMBrosia | |||||
| ECFP4 | Fingerprint similarity | 0.51 × 10⁹–5.0 × 10¹² | 11–343 s | 1.09 s per 109 nominal products | Fastest. Offers the best overall size-adjusted performance in combinatorial spaces. |
| fCSFP4 | Feature-enriched fingerprint similarity | 0.51 × 10⁹–5.0 × 10¹² | 13–507 s | 1.45 s per 109 nominal products | Approximately 1.3× slower than ECFP4 after adjusting for space size. |
| SpaceMACS | Maximum common substructure similarity | 0.51 × 10⁹–5.0 × 10¹² | 25–357 s | 2.99 s per 109 nominal products | Approximately 2.8× slower than ECFP4, but markedly more competitive than on enumerated libraries. |
| FTrees | Fuzzy pharmacophore similarity | 0.51 × 10⁹–5.0 × 10¹² | 119–1,386 s | 8.67 s per 109 nominal products | Approximately 8.0× slower than ECFP4 after adjusting for nominal Chemical Space size. |
|
Calculation: Size-normalized runtime = total runtime for all 2,917 queries ÷ collection size. Values shown are geometric means across the collections in each category. Enumerated libraries are normalized to one million stored compounds, while combinatorial spaces are normalized to one billion nominal products.
Important: The nominal size of a combinatorial Chemical Space does not represent the number of molecules individually enumerated or inspected during a search. These values describe collection-size-normalized benchmark performance and should not be interpreted as literal compound-processing rates. |
|||||
| Comparison | Closest search types | BioSolveIT runtime | Competitor runtime | Indicative advantage | Core conclusion |
| Reported Performance Comparison | |||||
| BioSolveIT vs RDKit | Fingerprint similarity and substructure-oriented synthon searching | 0.031–0.053 s | ~0.25–1.5 s Substructure <10 s Fingerprint |
~5–30× Substructure >100× Fingerprint |
BioSolveIT provides substantially higher throughput, particularly for fingerprint similarity searching. |
| BioSolveIT vs NextMove Arthor | Fingerprint similarity and structure or SMARTS searching | 0.031–0.053 s | ~0.10–0.49 s Fingerprint <8 s Worst-case SMARTS |
~3–16× Fingerprint Up to ~150× SMARTS comparison |
Arthor achieves high enumerated-library throughput, but its peak benchmarks use considerably greater CPU and memory resources. |
| BioSolveIT vs Alipheron | Fingerprint, similarity, and substructure-oriented Chemical Space searching | 0.031–0.053 s | 2.0 s median HyperSpace |
~38–65× | Both platforms provide interactive Chemical Space searching, but BioSolveIT reports markedly shorter runtimes for repeated 2D searches. |
| Important: These values originate from different publications, hardware configurations, Chemical Spaces, query sets, search definitions, hit rates, and result limits. They provide an indicative comparison rather than a controlled head-to-head benchmark. Full benchmark details, CPU context, methodological differences, and individual limitations are provided in the detailed comparison tables below. | |||||
| Software | Search method | Search type | Runtime per query | Runtime for 2,917 queries | Interpretation |
| BioSolveIT Chemical Space Search | |||||
| BioSolveIT | ECFP4 | Fingerprint similarity | 0.031 s | 1 min 31 s | Fastest BioSolveIT method in the supplied benchmark, averaging approximately 31 milliseconds per query. |
| BioSolveIT | fCSFP4 | Feature-enriched fingerprint similarity | 0.045 s | 2 min 11 s | Feature-enriched similarity searching while remaining within the millisecond-per-query range. |
| BioSolveIT | SpaceMACS | Maximum common substructure similarity | 0.053 s | 2 min 34 s | The closest BioSolveIT comparison to substructure-oriented synthon searching, although the algorithms are not equivalent. |
| BioSolveIT | FTrees | Fuzzy pharmacophore similarity | 0.160 s | 7 min 46 s | A more abstract scaffold-hopping search without a direct equivalent in RDKit SynthonSpaceSearch. |
| RDKit SynthonSpaceSearch — Published Benchmarks | |||||
| RDKit | SynthonSpaceSearch | Simple substructure search | ~0.25 s | ~12 min 9 s | Approximately 4.7× the BioSolveIT SpaceMACS average in the available cross-benchmark comparison. |
| RDKit | SynthonSpaceSearch | Generalized substructure search | ~1.5 s | ~1 h 13 min | Approximately 28× the BioSolveIT SpaceMACS average in the available cross-benchmark comparison. |
| RDKit | FingerprintSearch | Fingerprint similarity | <10 s | <8 h 6 min | The published RDKit value remains in the seconds regime, compared with tens of milliseconds for BioSolveIT ECFP4. |
| RDKit | SynthonSpaceSearch, optimized | Broad, high-hit substructure examples | 1.0–3.0 s | ~49 min–2 h 26 min | Highlighted 2026 examples with more than two million potential hits and up to 3,000 returned products. |
| Important: The BioSolveIT and RDKit values originate from different hardware, query sets, Chemical Spaces, hit rates, and result limits. The comparison is therefore indicative rather than a controlled head-to-head benchmark. BioSolveIT values are mean runtimes across REAL, GalaXi, Freedom Space, eXplore, CHEMriya, and AMBrosia. Estimated batch runtimes assume that the reported mean runtime can be applied independently to all 2,917 queries. | |||||
| Software | Search method | Search type | Runtime per query | Runtime for 2,917 queries | Interpretation |
| BioSolveIT Chemical Space Search | |||||
| BioSolveIT | ECFP4 | Fingerprint similarity | 0.031 s | 1 min 31 s | Ranked top-100 similarity search, averaging approximately 31 milliseconds per query across the six supplied Chemical Spaces. |
| BioSolveIT | fCSFP4 | Feature-enriched fingerprint similarity | 0.045 s | 2 min 11 s | Feature-enriched similarity searching while remaining within the millisecond-per-query range. |
| BioSolveIT | SpaceMACS | Maximum common substructure similarity | 0.053 s | 2 min 34 s | Ranked MCS-similarity searching rather than exact substructure matching. |
| BioSolveIT | FTrees | Fuzzy pharmacophore similarity | 0.160 s | 7 min 46 s | A scaffold-hopping method without a direct equivalent in Arthor. |
| NextMove Arthor — Published Benchmarks | |||||
| Arthor 4.0 | Inverted ECFP4 index | Fingerprint scan, 4.29 × 10⁹ entries | ~0.10 s | ~4 min 58 s | Derived from an average scan rate of approximately 42 billion fingerprints per second. Approximately 3.3× the BioSolveIT ECFP4 average, although this is scan time rather than a complete interactive response. |
| Arthor 4.0 | Inverted ECFP4 index | Fingerprint similarity, 3.59 × 10¹⁰ entries | 0.492 s | 23 min 55 s | Demonstrated interactive search checking 35.89 billion entries. Approximately 15.7× the BioSolveIT ECFP4 average. |
| Arthor | SMARTS substructure search | Exact substructure, 4.0 × 10⁹ entries | <8 s worst case |
<6 h 29 min | Up to approximately 150× the BioSolveIT SpaceMACS average in this cross-benchmark comparison. Selective queries may be considerably faster. |
| Important: The BioSolveIT and Arthor measurements originate from different hardware, query sets, database representations, fingerprint lengths, and result-generation workflows. Arthor searches explicitly enumerated molecular databases, whereas BioSolveIT searches compressed reaction- and synthon-based Chemical Spaces. The comparison is therefore indicative rather than a controlled head-to-head benchmark. The current Arthor release is version 4.3.4 from May 2026, but the most detailed publicly available quantitative benchmarks identified here were produced with Arthor 4.0 and earlier versions. Estimated batch runtimes assume sequential execution of 2,917 queries. | |||||
| Software | Search method | CPU context | RAM | Threads | Wall time per query | Thread-seconds per query | CPU-normalized context |
| BioSolveIT Chemical Space Search | |||||||
| BioSolveIT | ECFP4 | AMD Ryzen 9 5950X 16 cores / 32 threads |
62.7 GB | 32 | 0.031 s | ~1.00 | Lowest estimated computational cost in the comparison. Approximately one thread-second is required per query under the full-utilization assumption. |
| BioSolveIT | fCSFP4 | AMD Ryzen 9 5950X 16 cores / 32 threads |
62.7 GB | 32 | 0.045 s | ~1.44 | Approximately 44% more estimated CPU work than BioSolveIT ECFP4, while remaining within the millisecond-per-query regime. |
| BioSolveIT | SpaceMACS | AMD Ryzen 9 5950X 16 cores / 32 threads |
62.7 GB | 32 | 0.053 s | ~1.69 | Approximately 1.9× lower estimated thread cost than RDKit’s simple substructure benchmark and 11.5× lower than its generalized search. |
| BioSolveIT | FTrees | AMD Ryzen 9 5950X 16 cores / 32 threads |
62.7 GB | 32 | 0.160 s | ~5.11 | Higher computational cost than the other BioSolveIT methods, but FTrees performs fuzzy pharmacophore-based scaffold hopping and has no direct equivalent in RDKit or Arthor. |
| BioSolveIT hardware exception: The FTrees calculations for the Molport and Mcule libraries were performed on an AMD EPYC 7343 system with 16 cores, 32 threads, and 377.5 GB RAM. These two runs are not included in the six-Chemical-Space mean runtimes shown above. Because both BioSolveIT systems provide 32 logical threads, the arithmetic thread-second normalization is unchanged, although processor architecture and memory capacity differ. | |||||||
| RDKit SynthonSpaceSearch — Published Phase 2 Benchmark | |||||||
| RDKit | Simple substructure | Mac mini Apple M4 Pro |
64 GiB | 13 | ~0.25 s | ~3.25 | Approximately 4.7× slower by wall time and 1.9× higher by estimated thread cost than BioSolveIT SpaceMACS. |
| RDKit | Generalized substructure | Mac mini Apple M4 Pro |
64 GiB | 13 | ~1.5 s | ~19.5 | Approximately 28× slower by wall time and 11.5× higher by estimated thread cost than BioSolveIT SpaceMACS. |
| RDKit | Fingerprint search | Mac mini Apple M4 Pro |
64 GiB | 13 | <10 s | <130 | Only an upper runtime limit was reported, so an exact CPU-normalized comparison with BioSolveIT ECFP4 cannot be calculated. |
| NextMove Arthor — Published Inverted-Index Benchmark | |||||||
| Arthor 4.0 | Inverted ECFP4 index | 2 × AMD EPYC 7443 up to 96 threads |
1 TB | 96 | ~0.102 s | ~9.81 | Approximately 3.3× slower by wall time and 9.8× higher by estimated thread cost than BioSolveIT ECFP4. The Arthor benchmark scans 4.29 billion enumerated fingerprints. |
|
Important:
Thread-seconds are calculated as wall-clock time multiplied by the reported or available logical-thread count. This assumes that all threads are fully occupied for the complete runtime and therefore represents an upper-bound proxy rather than measured CPU consumption. Logical threads are also not directly equivalent across AMD Zen 3 and Apple M4 architectures. Differences in database size, compressed versus enumerated representation, query complexity, result limits, memory bandwidth, and caching prevent this from being considered a controlled head-to-head CPU-efficiency benchmark.
Sources: BioSolveIT SpaceLight, BioSolveIT SpaceMACS, BioSolveIT FTrees, RDKit Synthon Search, and NextMove Arthor. |
|||||||
| Software | Search method | Search type | Runtime per query | Runtime for 2,917 queries | Interpretation |
| BioSolveIT Chemical Space Search | |||||
| BioSolveIT | ECFP4 | Fingerprint similarity | 0.031 s | 1 min 31 s | Approximately 65× faster than the reported HyperSpace median. |
| BioSolveIT | fCSFP4 | Feature-enriched fingerprint similarity | 0.045 s | 2 min 11 s | Approximately 44× faster than the reported HyperSpace median. |
| BioSolveIT | SpaceMACS | Maximum common substructure similarity | 0.053 s | 2 min 35 s | Approximately 38× faster than the reported HyperSpace median, although MCS similarity and exact substructure searching are not identical tasks. |
| BioSolveIT | FTrees | Fuzzy pharmacophore similarity | 0.160 s | 7 min 47 s | No direct HyperSpace equivalent; the closest Alipheron method is Pharos3D, which uses explicit 3D shape and pharmacophore matching. |
| Alipheron Chemical Space Search — Published and Commercial Figures | |||||
| Alipheron | HyperSpace Search | Precise substructure and structure similarity | 2.0 s median | ~1 h 37 min | Current commercial figure based on more than 6,500 searches. Separate runtimes for substructure and similarity modes are not disclosed. |
| Alipheron | HyperSpace algorithm | Exact substructure search | A few seconds | Not precisely calculable | The original publication searched the approximately 30-billion-product Enamine REAL Space using 8 threads on a six-core Intel Core i7-7800X. |
| Alipheron | Pharos3D | 3D shape and pharmacophore similarity | Not disclosed | Not calculable | Computationally more demanding because conformers are generated for thousands of partially assembled and fully enumerated candidates. |
|
Important:
The BioSolveIT and Alipheron measurements originate from different hardware, Chemical Spaces, query sets, search definitions, result limits, and statistical summaries. BioSolveIT values are arithmetic means from 2,917 top-100 searches across six Chemical Spaces, while Alipheron reports a median of 2 seconds per space across more than 6,500 recent searches. HyperSpace may return thousands of threshold-matching structures, whereas the BioSolveIT benchmark requested only the top 100 results.
The BioSolveIT benchmark used an AMD Ryzen 9 5950X with 16 physical cores and 32 threads. The original HyperSpace publication used 8 search threads on an Intel Core i7-7800X, but the hardware used for Alipheron’s current commercial median is not disclosed. Consequently, the wall-clock comparison is informative, but a defensible CPU-normalized comparison cannot be calculated. |
|||||
| Method | Search principle | Full-space search | Structural exactness | Best suited for |
| Similarity Search Methods | ||||
| ECFP4 / fCSFP4 | Fingerprint similarity | Yes | Approximate ranking | Fast analog searches and close-neighbor retrieval |
| FTrees | Fuzzy pharmacophore similarity | Yes | Abstract representation | Scaffold hopping and identifying functionally similar molecules |
| SpaceMACS MCS | Maximum common substructure similarity | Yes | Atom-level MCS | Finding structurally related analogs and conserved cores |
| Exact Structure Search | ||||
| SpaceMACS Substructure | Exact substructure or SMARTS matching | Yes | Exact | Locating defined motifs, scaffolds, and substitution patterns |
| Important: Full-space search does not mean that every product is generated individually. The algorithms search the compressed synthon and reaction representation and materialize only the requested top-ranked or matching products. A result limit may therefore restrict how many qualifying molecules are returned. | ||||